
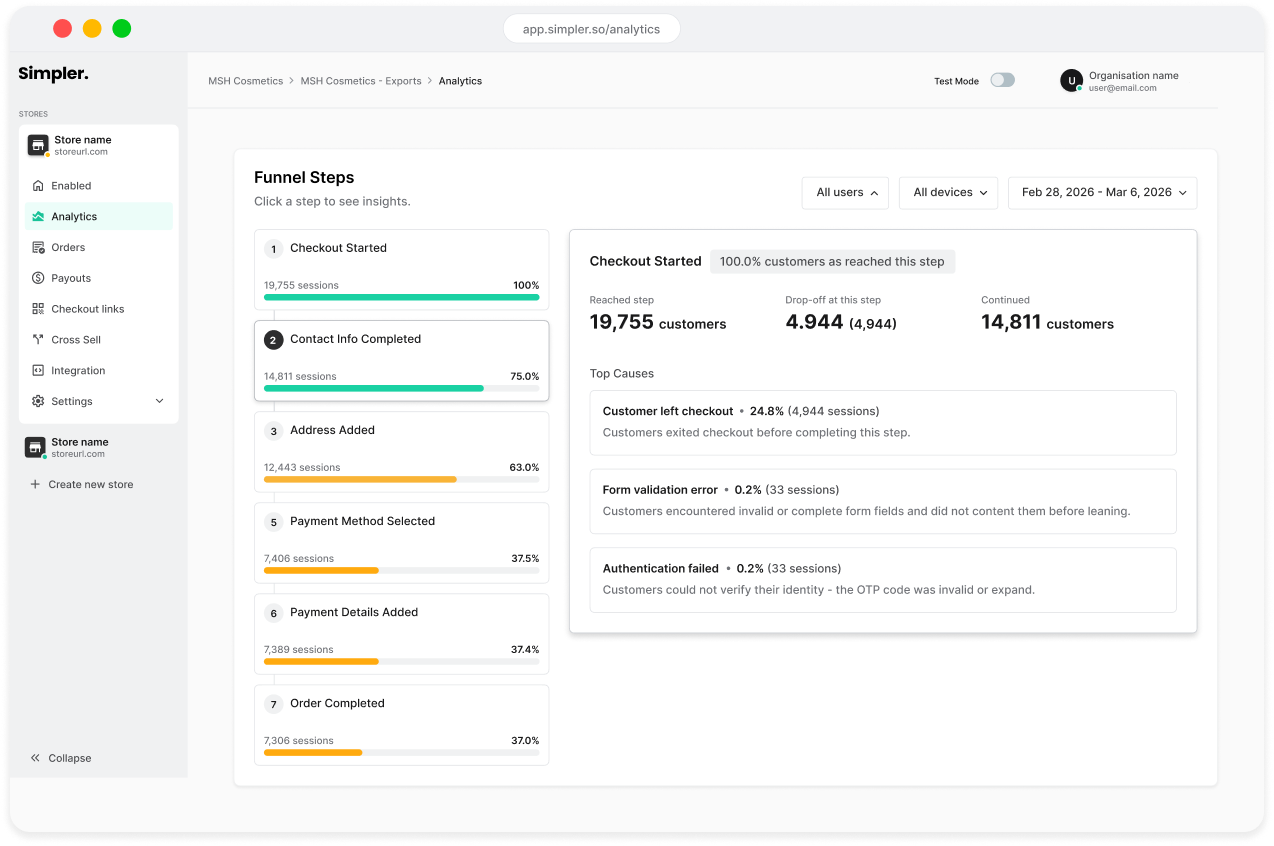
Turn checkout into your clearest source of truth.
Instead of reconciling GA4, ecommerce and plugin data, see exactly how shoppers move through your checkout in one reliable funnel view.

One analytics suite for the questions that actually move revenue.
Most ecommerce teams stitch together GA4, their platform and a handful of plugins — and still can't agree on the numbers. Simpler gives you a single source of truth across the four areas that drive growth: discounts, audiences, customer behaviour and retention.

Coupon ROI
Which codes actually pay back vs quietly burning margin.

Audience mix
Who's buying — by device, account type, new vs returning.
Discount habits
Whether your promotions build loyalty or train shoppers to wait.

Cohort retention
How each acquisition month performs over time.
Beyond the funnel: the full picture
of your revenue.
Coupons, audiences, discount habits and retention — all in one place, so every team works from the same numbers.
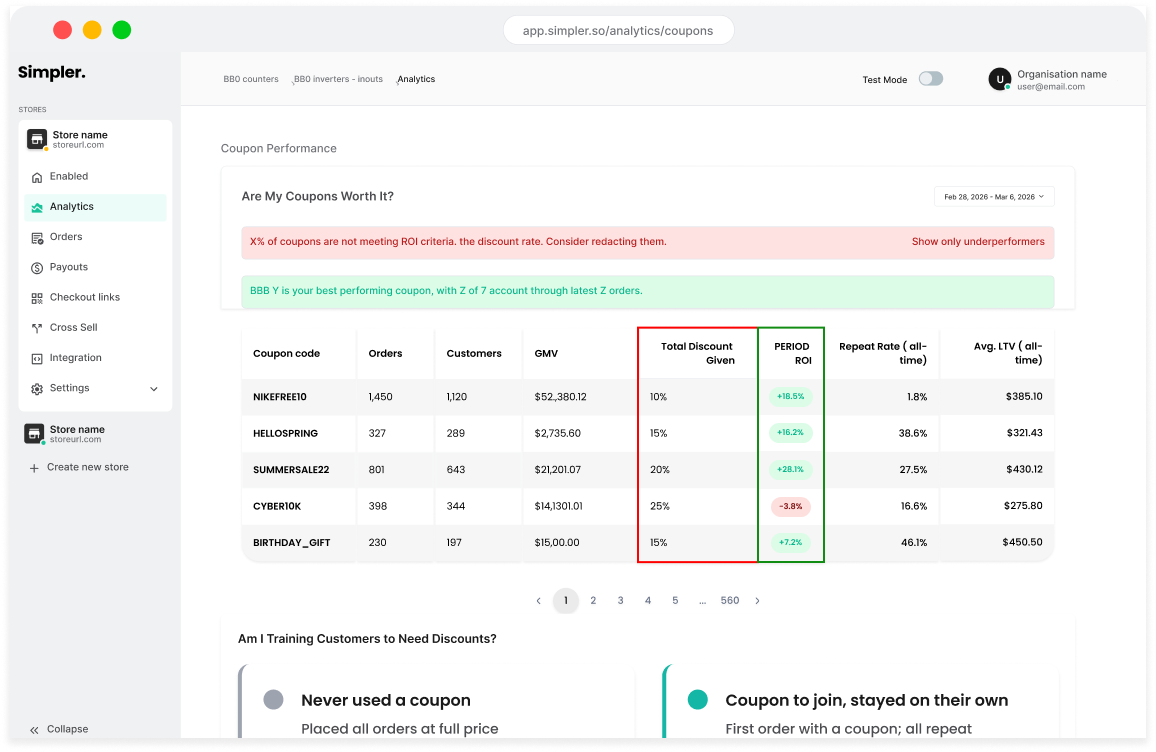
Know which coupons actually pay back

See ROI per coupon code: revenue brought back vs discount given.
Spot underperformers automatically — codes that cost more than they return.
Identify your hero codes and double down on what drives real LTV.
MiiN used this to identify 3 underperforming codes within 48 hours — codes returning less than €0.40 per €1 discounted. Dropped them before the campaign extended.
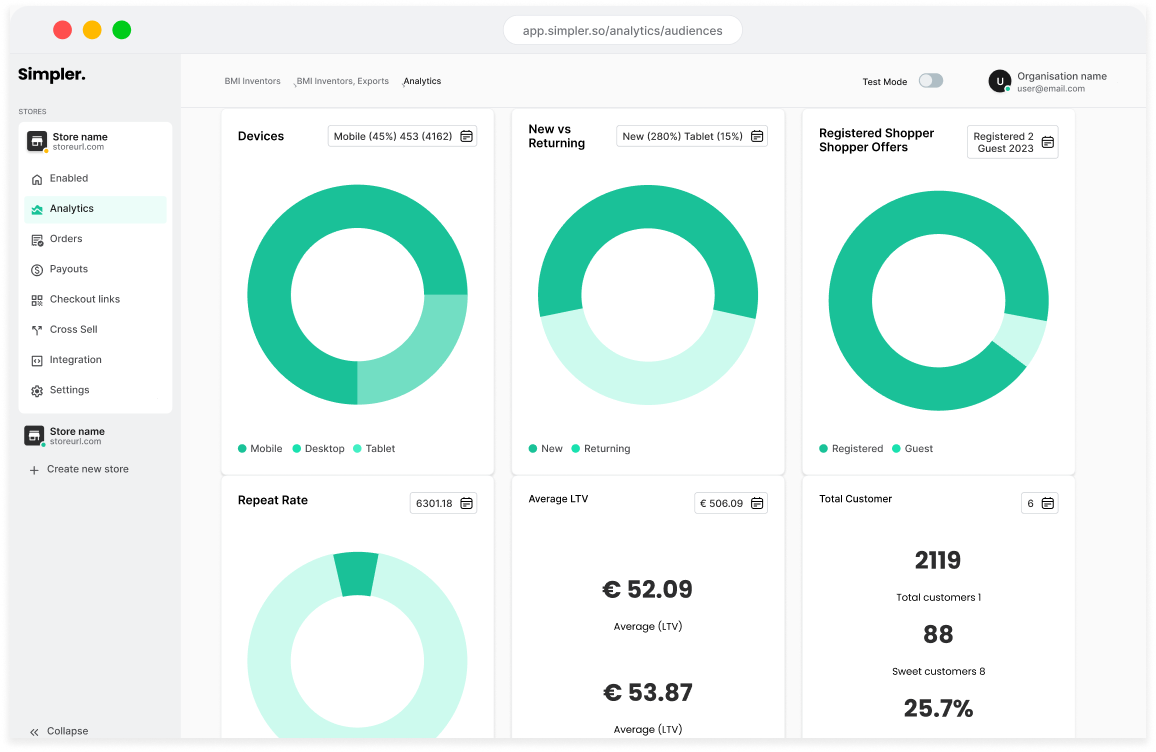
Understand who's actually buying
Devices, new vs returning, registered vs guest — at a glance.
Track average and median LTV alongside repeat rate in real time.
Quantify your top 10% LTV share to see where revenue concentrates.
→ Merchants with high LTV concentration in the top 10% use this segment to brief paid campaigns — typically seeing 15–25% lower CAC when targeting registered returners vs. broad audiences.
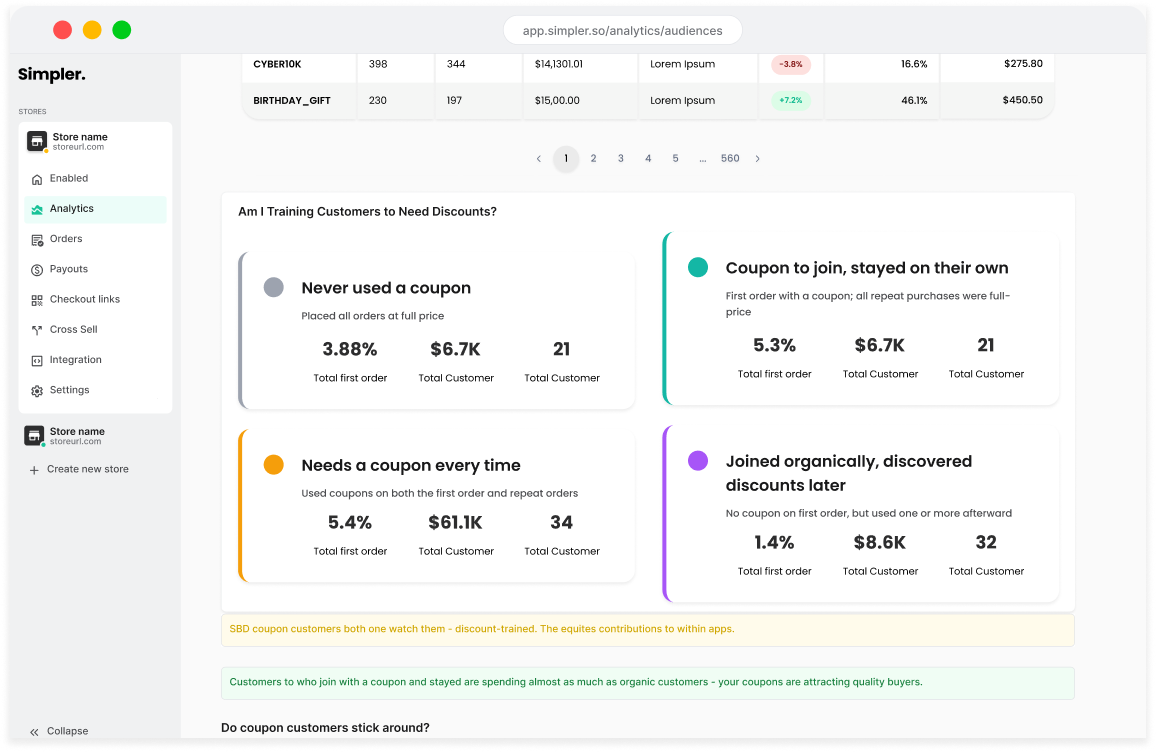
Are you training customers to wait for discounts?
Segment buyers into never-discounted, organic-then-coupon, coupon-trained and converted-organically.
Compare lifetime spend and order frequency across each segment.
Get clear flags when discount-dependent behaviour starts eating your margin.
→ Coupon-trained customers show 30–40% lower 12-month LTV than organic buyers. This view flags the shift before it becomes your new baseline.
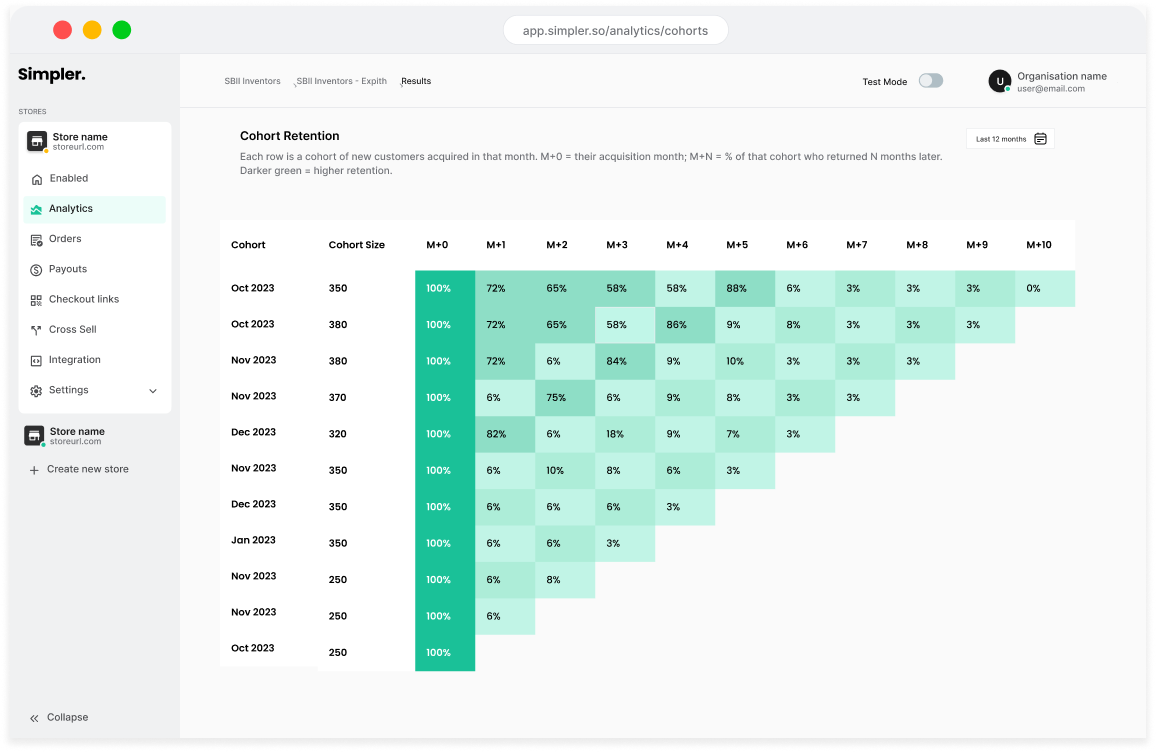
See how customers actually come back
Monthly cohorts with month-by-month retention in a colour-coded heatmap.
Spot which acquisition months produce your stickiest customers.
Measure the long-term impact of campaigns, launches and seasonal pushes.
→ See exactly which acquisition months hit payback within 3 orders — and which needed 7+. Ties campaign ROI to long-term retention, not just first-purchase volume.
How MiiN closed a 20% data gap and started making margin decisions from a single number.
MiiN Cosmetics, a leading Korean beauty retailer in Europe, used to combine GA4, PrestaShop and other tools, often seeing up to ~20% differences between reports. Today, their ecommerce lead monitors performance directly in Simpler's checkout analytics to understand what's really happening in the funnel.

"We were reconciling GA4 and PrestaShop every week and still ending up with a 20% variance. Now there's one number. The conversation with the team starts from the same place."
"The discount segmentation was uncomfortable at first — you see clearly which customers have learned to wait for a code. But that's exactly what you need to see to stop the habit from spreading."
"I check the funnel most mornings. Not because something is broken — because I actually trust what I'm looking at."
What changed for MiiN
Closed a ~20% reporting gap between GA4 and PrestaShop data — one funnel view, no reconciliation.
Identified coupon-dependent buyer segments within the first week of using Discount Habits.
Funnel monitoring dropped from a multi-tool process to a 20-minute daily check.